


Determining Impact in HR
How do you know if what you're doing is working? The nuances of measurement, assessment, and evaluation in HR.

How do you know what you’re doing is working? Often HR programs are launched because someone heard it was working somewhere else (best practice justification) or because that’s what someone did in a prior situation (confirmation bias) which leaves everyone wondering if the money and time spent on DEI, L&D, recognition, or compensation initiatives is worth the effort.
If you want to be successful in a business, you must create value for a customer. Traditional Organizations usually think of Human Resources as a cost and therefore seek to minimize that cost at every turn. Costs are a burden to customers through pricing, so obviously lower prices are good for customers and any additional expenses due to the cost of employment are not welcome to most business leaders.
It makes sense to be cost effective in HR, but it makes more sense to manage a business using an investment mindset, where costs are only part of an evaluation. The full question is, what gains have been made as a direct result for the costs I’ve incurred? This is especially true in a business that relies on human creativity to create consumer value.
One challenge with a return on investment (ROI) evaluation is the time it takes for value to emerge. People and organizations require months and sometimes years to evolve and the effects of many investments occur outside typical monthly or quarterly reporting cycles.
Another challenge is isolating the inputs of a system and linking them directly to the outputs. Most businesses have a complex value system so it’s important to understand that full context to apply rigorous measurement techniques that illuminate what is working and what can be improved or eliminated. In this case we’re asking, what human behaviors create the most value?
A third challenge is the complexity of human behavior. People and organizations are idiosyncratic which makes it hard to apply generalized concepts to any particular setting. In this challenge we’re asking, what conditions create the best outcomes in human behavior, here and now? Effective evaluation will seek answers to both questions and provide a framework for identifying, tracking, and comparing the most important variables in the mix over a sufficient period in a specific group.
A fourth challenge is applying appropriate rigor to the evaluation process itself. Businesses are not always good at monitoring themselves because the effort to evaluate work in progress is yet another overhead cost. Deep understanding of human behavior is often left to academic domains where costs are managed as grants not as threats to a healthy margin.
An effective people function should include people analytics as a natural component of everyone’s role, not separated out into a bureaucratic function. People analytics is integral to any program, process, or tool and should be evaluated as a component of program management, the same way products are evaluated by the product managers themselves.
One time at Hulu, our Benefits Manager came to me with a budget request to add a new yoga class to our offer. I’m a fan of yoga and think activating our bodies during the workday can have a positive effect. We were doing well as a business, and it would have been easy for me to simply approve the request and bring it up in my next finance review as an “add” to our spending.
I asked the manager why she thought it would be a good idea. She pointed out that our on-site massage sessions were getting 10/10 reviews and were always completely booked, so we should offer more things. She added that Google was offering yoga, so we should follow suit because it made our perks look competitive. I wish she hadn’t said that! I was instantly suspicious of this approach to our benefits and decided it was time for my team to up their game in program evaluation and business influence. If I had brought that same rationale to our Finance team or to my boss the CEO, they would dismiss me as an indulgent spender on the dole. Furthermore, this type of escalation is a wasteful “arms race” where you spend more because others are spending more even if you don’t know what impact you are getting.
Instead of giving the approval, I hosted a meeting with my full team to talk about program design and evaluation. The first thing we discovered was that our massage program was getting great ratings and was always full, but the participation rate was only 10% of our employee population. In other words, a small slice of our team enjoyed it very much, but was it a successful program?
The satisfaction with the service was an interesting metric, but it doesn’t tell us the business question we need answered to decide if it’s worth doing. I’m pretty sure you’d get high satisfaction if you served free beer every day and offered on-site dry-cleaning (Wait, people actually do that?). Before launching and committing to any type of HR program or process it’s essential to be thinking in terms of these questions:
This became the focus of our meeting: Can we answer any of these questions for anything we are doing? At that point, the answer was no. We had a lot of opinions based on what other companies do and based on satisfaction surveys for each individual element but could not create a clear connection between any program and customer value or revenue at our company, only costs and program quality.
- Does it work?
- Does it matter?
- Does it make an impact?
- Does it make a difference?
- Does it meet expectations?
- Is it worth the effort?
- Is it better or worse?
Understanding Impact
We need to know how to measure, assess, and evaluate to understand and answer these questions. Measurement means to apply a standard scale or measuring device to an object, series of objects, events, or conditions. Measurement, according to practices accepted by those who are skilled in the use of the device or scale.
Measurement helps you understand facts:
- When did it happen?
- How many people were there?
- How often does it happen?
- Who does it most?
Measurements can:
- Demonstrate frequency
- Compare frequency over time
- Sort types
- Compare types
Measurements do not:
- Demonstrate value
- Provide insights
- Predict outcomes
- Determine progress
Assessment Helps You Understand Progress
Assessments determine if an objective or goal has been achieved, usually through some kind of opinion survey. We can measure a person’s knowledge in a variety of ways, but there is always a leap, an inference that we make about what a person does in relation to what s/he knows or thinks.
Formal assessment moves beyond a single observation and into a more complete and rigorous capture of the observations, usually with input from multiple perspectives to increase validity and reliability. All human observation has bias and is subject to error for hundreds of predictable reasons. The most important thing about assessment is determining what questions to ask and what type of scale to provide.
Assessment is a type of measurement that helps us gather input from other people. It is often subjective, not nominal. How a question is phrased can significantly alter the information gathered. Assessments often use a rating scale to gather high quality and easy-to-interpret qualitative data, we often call feedback. A rating scale uses closed questions to gather information from a target audience in various ways like these:
- Satisfaction level
- How much you agree/disagree with a statement
- How easy you found something to use
- How much you would recommend a service
According to Survey Monkey, there are dozens of question types including the following list they recommend as the “best types” for gathering information from employees:
- Multiple choice questions
- Rating scale questions
- Likert scale questions
- Matrix questions
- Dropdown questions
- Open-ended questions
- Demographic questions
- Ranking questions
- Slider questions
Evaluation helps you understand value
The purpose of evaluation is to make a judgment on the quality, importance or value (note the common root) of something and it results in a decision to act or not. We use measurement and assessment to gather data and information to support a decision. Data alone cannot make a judgment, it requires context, purpose, and critique. Analysis is a form of System 2 thinking that requires more expertise and effort than simple reporting of facts. It would be nice to have a single number to indicate if something is working or not, but we must establish the meaning of the number in context before it’s useful. Once established, a metric can serve as a decision indicator, but only if the context has been established and the value of the number is clear.
Here’s a simple way to get this all straight. Imagine yourself driving down on a road. Your speedometer shows you moving at 50 MPH. Your speed is a measurement using a standard scale. Are you going too fast? I’m sure the first thing that popped into your head was a thought like, it depends. Imagine you are the driver, and your partner is in the passenger seat looking ill, grabbing the safety handles and pressing their head back against the seat. Are you going too fast? Maybe, but it still depends on things like this:
- Are you going to the hospital because this person is in serious pain?
- What is the speed limit?
- Is it raining?
- Are there curves on the road?
- Is the road paved or gravel?
- Are there other cars around you?
- Is this a School Zone?
- Are you in a car, truck, or golf cart?
Answering these questions is how you assess the situation, often with simple observation. Your final answer (Yes/No) is your evaluation, and you behave according to that judgment. With answers to your assessment questions, you can make a judgment using the measurement data (quantitative) and the assessment data (qualitative). This behavior can be either a System 1 or System 2 decision, but in either case it’s based on measurement, assessment, and evaluation.
Evaluating your own driving is made easier and more reliable with the use of speed limits. We know it’s too fast to drive 50 in a School Zone, because the limit is 20 MPH. We can quickly decide it’s too fast by comparing our speed to the posted limit. It’s much harder to decide when you are within the speed limit, but there are other conditions that affect your safety like weather or traffic. It’s even harder when one of your passengers has a lower threshold for risk and feels so uncomfortable with your speed that they yell at you to slow down. Your decision on how fast to drive is based on all three of these factors and results in a summary evaluation and your decision on how you will drive in that moment.
This is what we are called to do in program management. We have some areas in which we can decide and others where our evaluation will support decisions made by a supervisor or leadership team. To ensure the quality of these evaluations we need to have a complete measurement and assessment strategy and be confident in the quality of our data.
Understanding Rigor
To ensure high quality data, we must consider how we measure, as it’s easy to introduce bias or miss key data if the techniques are not managed carefully. In social science this is called rigor. In practical measurement rigor refers to the level a metric, survey, assessment, or tool provides information that is both valid and reliable and whether the technique is realistic for practitioners and researchers to manage. In a business setting, we often make compromises in overall rigor because the measurement techniques necessary for absolute rigor or too expensive, slow, or complicated to administer. That said, we really need to up our game in measurement and stop using untested, unreliable practices simply because they sound good or seem to work elsewhere.
Talent Management expert Marc Effron shows how the common approach to conducting 360 Skill Assessment has many flaws in his article, Why 360s Don’t Work (and how to fix them). Check out the article for seven great tips to run better assessments, but here’s a highlight to show how something subtle in the assessment design can be so important:
Direct, don’t rate: Many popular 360’s rate how well a leader performs a particular competency or behavior. For example, a leader would know they are rated a 4.2 on a 5-point scale. While that rating may be accurate, the practical challenge is that it provides no directional advice to the participant.
Does a score of 4.2 out of 5 tell a leader that they should do more of that behavior? Do less? Not change it? The science is clear that being rated does not motivate change, so there is no development value in using a classic rating scale.
Our advice: We believe that the scale of a developmental 360 should tell a leader how to adjust their behavior – Do More, Do Less or Don’t Change. That scale instantly provides the leader with direction about what to do. When combined with the prioritization and verbatim comments guidance, it makes it easy to understand what to change and how to change it.
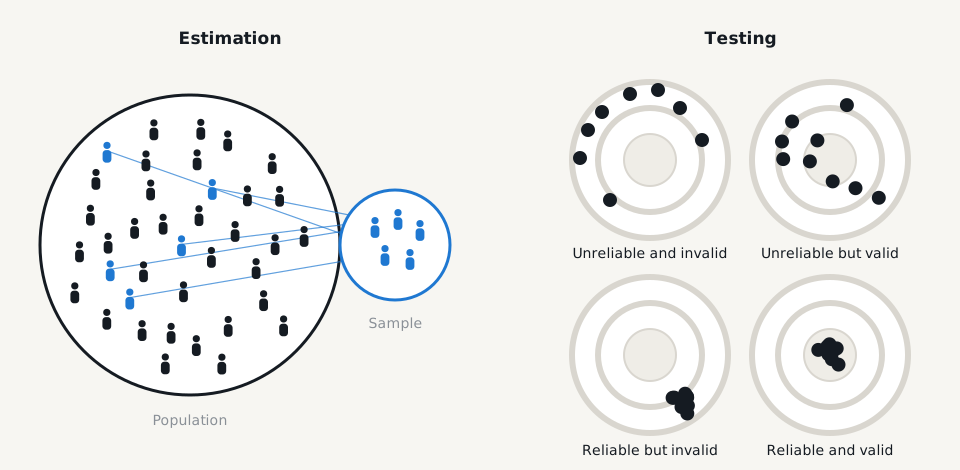
Did you target the right audience to gather your data? Understanding who you should ask and what you need to ask can greatly affect the validity and reliability of your data. It’s also essential to understand who you should target with your measurements and assessments with full awareness of population and sample techniques. Is the group that responded representative of the population as a whole? This comes up every time someone runs an engagement survey and gets less than 100% response rate.
If your response rate is not everyone in the company, you must understand which parts of the company did and which parts did not respond. Was it all the people in one location? Was it a large portion of one department? Did all women respond, but only a portion of the men? Population and sampling depend on statistical significance within each group or the information you’ve gathered could be biased, making it either invalid or unreliable.
Remember the example of our satisfaction survey for massages at Hulu? The survey indicated that people who used it indicated with very high satisfaction scores that they loved the service and would like it to continue. The problem we had with that data as a basis for our decision to invest further is based on sampling error. The set of people in the survey were all users of the service, so we can rely on them to give feedback on its quality. We cannot rely on them for feedback on continuing the service because we didn’t ask anyone who doesn’t use it. Our sample was biased. We also didn’t ask any questions to put the service in context of other perks or benefits like yoga or exercise classes, so our data is not valid.
Validity means the measurement you take represents the value you want to understand. Speed is an accurate predictor of safety in driving because there are more frequent and more harmful accidents at high speed than low speed. Reliability means the measurement can be captured accurately over time and across relevant sources. If men consistently answer a question one way and women consistently answer the same question another way, there would be statistical significance in the gender response to the question. If some men and some women answer the question the same and differently there is an unreliable gender difference, so it wouldn’t be a useful measure.
It is rare that you can find one single program that makes all the difference in creating a high performing, sustainable organization. You can use program evaluation to determine if individual components are integral, but complicated and confusing to keep track of them all without a story to explain your hypotheses and results. Also, using words like hypotheses and results might sound overly scientific to your audience and bore them senseless!
Stories Facilitate Understanding
Below is a framework for understanding and explaining Employee Lifetime Value (ELTV) a technique for demonstrating ROI. The four categories across the top are essential elements of an employee journey as levers that affect employee performance, and they serve as broad categories for more specific programs, processes, or practices called interventions in social science. Each category contains a set of metrics that contribute to the overall calculation. For example, you could identify an interview scorecard as an intervention to improve interview quality within the Selection category. Defining and tracking the full set of metrics usually requires input from several departments and strong partnership with your Finance team.
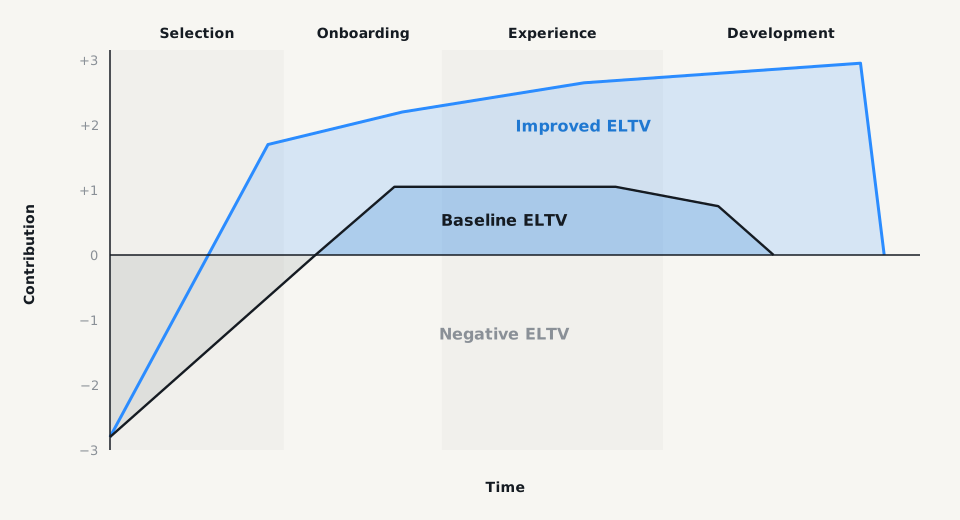
Some programs work better than others and often it takes a combination of interventions to achieve a valuable outcome. You can use established human behavior research to find ideas for interventions, but you can also just experiment with your own ideas to see what works best. Using the established body of research allows you to focus on a small set of variables instead of trying to measure and report on everything you do. The key starter question is, what will make the biggest constructive difference in the next 3-12 months? Don’t overlook the obvious or the simple, sometimes that’s the easiest and best way to get things rolling.
To understand if something working, you need to establish a starting position or baseline. Your baseline is defined in your hypothesis as part of your problem statement. For example, “We expect to see lower attrition and higher initial satisfaction with people we hire using an interview scorecard.” You may need to discover your current attrition and initial satisfaction before you launch the scorecard. You can also try removing something from your experience and see if that makes a difference. Over time you can develop a rhythm of quarterly and annual experiments that test your effectiveness and evaluate your ideas.
When I arrived to lead the Organization Development function at Mercury Interactive (a SAAS business that is now part of Hewlett Packard) I was challenged to address an urgent attrition problem resulting from several recent acquisitions. I had an existing hypothesis that employees leave managers, not companies based on broad research conducted by the Gallup Organization, so I conducted a survey asking about our current people management practices. I quickly noticed that most people were not having regular 1:1 meetings with their managers. The reasons varied, and we were also not sure if managers could even run this type of meeting effectively.
We aligned around the belief that something is better than nothing and established a quarterly metric to measure the frequency of these meetings. I created a report for the CEO that showed who completed them, and how often they occurred, broken out by function and location. The simple act of measuring improved the frequency immediately and over the next several quarters we also invested in the quality of those meetings. Within 2 quarters we saw increased retention correlated to the 1:1 meeting scores. Referring to the ELTV framework, this intervention would sit inside the Experience category and show an extension in tenure contributing to greater employee lifetime value.
To help you keeping track of everything you launch, summarize the various interventions into a table like this one:
ELTV Design Tracker
- Selection: interview template; sourcing pipeline; anonymous input on decisions
- Onboarding: new hire assigned a buddy for the first month
- Experience: manager 1:1s twice a month; weekly team updates; well-being ritual cards
- Development: self-review template
You want to identify and track a “select few” set of interventions so you can have more clarity about what works as expected. I’ve shown here how you can include internal process improvements, but also how you might embed a tool or platform from a vendor. For example, a benefits platform may provide “ritual cards” that allow each team to select a new practice they want to implement and then provides a pre/post measurement technique with their proprietary assessment. When considering this type of platform as a one-off or standalone decision it might be overwhelming. When placing the service in the context of the Experience category and using the tools included within it, it becomes an easy piece to fit into the puzzle.
Similarly, the performance management platforms provide a unique set of developmental tools like a self-review template and review process that fits another piece into the ELTV puzzle. Instead of seeing these tools and platforms as trade-offs in a cost accounting mindset, this framework allows you to see both as proper investments in ELTV that can be tracked and correlated with desirable business outcomes.
Below is a results summary published in Harvard Business Review by Amy Edmondson and Henrik Bresman. She has spent her career exploring the idea that psychological safety is essential to high performance. She has rigorously identified the variables and conducted studies that demonstrate high correlation. When this paper was posted on LinkedIn, the comments were riddled with detractors calling out the validity of the findings. The irony of the negative comments is evident when you read the introduction of the study:
“When teaching groups of executives, we often ask them how diversity affects teams’ performance. The vast majority are convinced that more diverse teams will outperform less diverse teams — particularly when the project involves innovation. Their argument is familiar: The different perspectives, ideas, and opinions in diverse teams are essential to achieving breakthrough performance in competitive environments. In practice, however, diverse teams often underperform relative to homogenous teams.”
Here’s the chart that attracted the snarky “smart talk” comments that showed very little curiosity and revealed that most of the commenters had not read the article. The black dots represent teams with high psychological safety and the gray dots represent teams with low psychological safety.
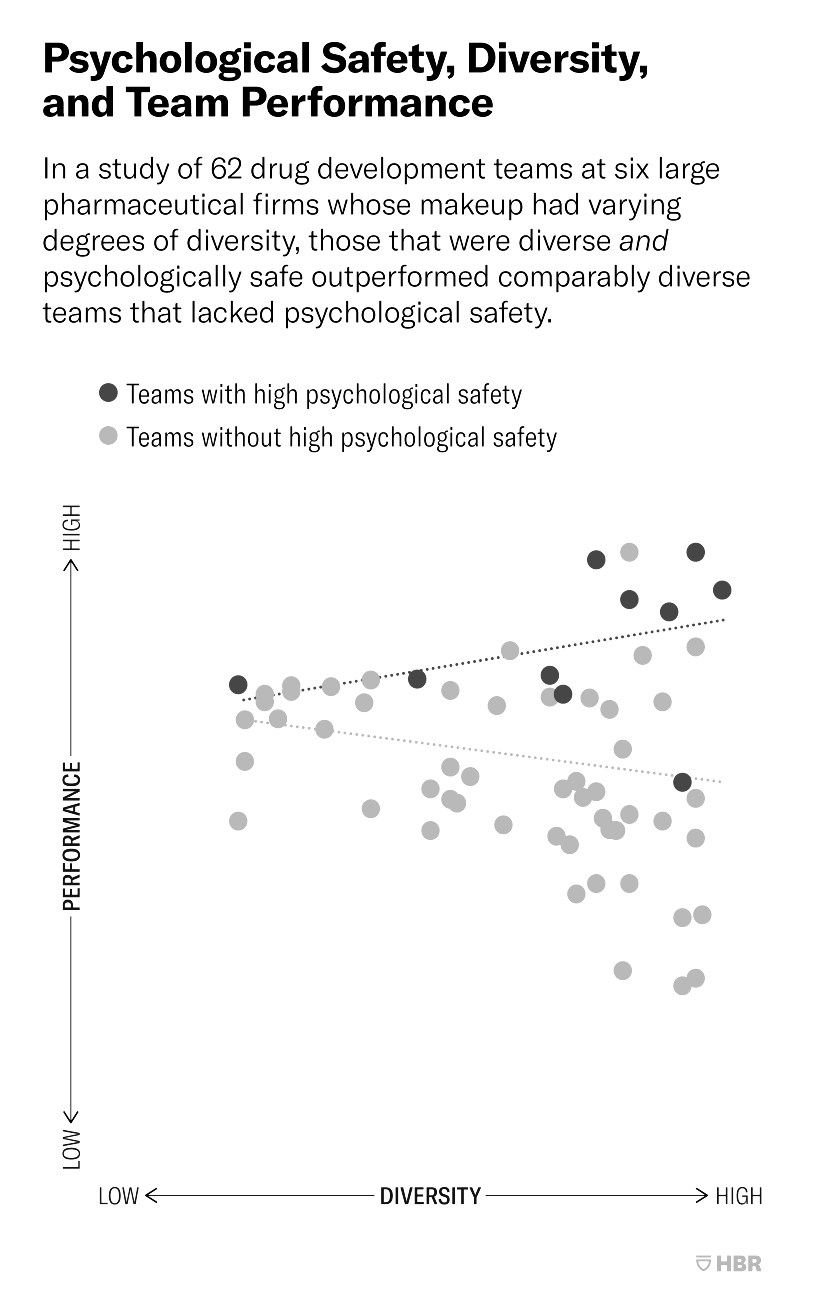
Chart: Harvard Business Review, 2022.
Does this chart prove that diverse teams are more psychologically safe? Nope. Does it mean that psychological safety creates diversity in teams? Nope. It simply shows a mathematically defensible pattern of high-performing teams also being diverse. As a stand-alone finding, it changes nothing. As a contribution to the broader understanding of humans and work, it’s a valid and reliable piece of the puzzle and helps us have more confidence in our interventions going forward.
With most experiments, we’re not aiming for proof or trying to win an argument. We’re aiming for incremental improvement, directionally correct adjustments, and greater effectiveness. I’ve always found it interesting that business leaders will consider 65% approval of a performance management process acceptable, but a 65% customer approval rate would cause panic and people would get fired. Imagine 65% “up time” for your web services. Not acceptable. You don’t need to prove that something is conclusive with your experiment, you need to show that it makes a constructive difference that correlates with business impact.
According to management expert Roger Martin, facts are insufficient to support your decisions. You need imagination to get from today’s reality to what could be real tomorrow. I’m not talking about free-form whiteboard doodle imagination (i.e. Harold and the Purple Crayon). I’m talking about reasonable, insightful leaps in thinking based on a sober assessment of the status and the potential. Some people call this “outside of the box” thinking, Roger Martin calls it abductive reasoning. Without it, you are forced into followership because you never jump ahead.
A real data-driven environment will contemplate most if not all the key variables that are both necessary and sufficient to make a difference. People and organizations are messy. To be an active manager, not an academic reporter, you need real-time data to inform and adjust your management behaviors continually, just as driving a car requires a dashboard with real-time indicators like speed, available fuel, and temperature. These are the leading indicators that you will make it to your desired destination and if they start to deviate from your expectations, you can adjust either your behavior or your expectations.
In summary, people science isn’t science if you don’t utilize proper measurement, assessment, and evaluation techniques. But science can be dry and difficult to understand without proper storytelling. This is why people like Carl Sagan, Bill Nye, and Mark Rober are so popular. They make the complex simple and even fun to explore. They use data to underscore key elements and set up experiments that support leaps in imagination. Ultimately, it is more important to be an effective storyteller than to present immutable proof that something will work. Directionally correct and business-defensible are effective standards to carry the day in most business situations.
Many business leaders say they are looking for data-driven leaders but beware of any executive who has strong opinions and no data to back them up. Despite the call for data, many leaders feel threatened when their beliefs do not hold up to the facts, and they can be amazingly stubborn. Stay out of yes/no approvals and win-lose fights over facts and data. Influence requires patience and persistence. Show your recommendations, support them with data, and shift to curious questions that lead to a collaborative decision to launch an experiment and see how it goes from there.